
Quick Tip: Faster Element Inspection with Safari and iOS Simulator
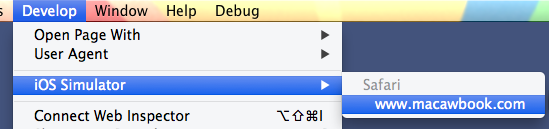
Chrome and Firefox are probably the gold standard for friendly web developer tools, but I still use Safari all the time. It's the best option for debugging sites on iOS using the remote debugging features. You open your site in Safari running in the iOS simulator, and in the Develop menu, like this:
With that inspector open, you can view the JavaScript console, inspect the live DOM, and all the other things you can do with the Safari Web Inspector. What isn't obvious is that you can also use the Inspect button to choose an item shown in the iOS Simulator and open it directly in the DOM inspector. I thought you had to do everything on the Inspector side, which is kind of a pain to do for deeply nested items. It really is as easy as clicked Inspect in the Web Inspector and clicking the item you want to inspect in the iOS Simulator window. Nice!
Chrome's remote debugging for Android devices is more fully-featured, with better remote controlling of the device and whatnot, but iOS remote debugging is easier to set up, and still very helpful. Inspecting elements directly this way is going to save me a lot of time.