
Configuring PhpStorm to debugging command line PHP scripts
Working for years with Drupal's command-line tool drush, and more recently with Laravel's artisan, I've had occasion to interface with Xdebug in my favorite IDE, PhpStorm. Here's how I am currently working with all of these tools together.
Incidentally, if you've never tried a real debugger in your projects, you can check out my talk from WordCamp Orange County, "Let's Debug for Real", which was recorded from the audience, or a higher-fidelity version from a JavaScript perspective, my lynda.com course Debugging the Web: JavaScript.
Here's how this will work: you'll do some initial configuration in PhpStorm and your local web stack, set a breakpoint somewhere in your code, then run your command line script from within PhpStorm. If all goes well, execution will stop at the breakpoint and you'll be off to the debugging races.
General Setup, Mostly in PhpStorm
I'm currently using MAMP Pro, about which I feel less cool all the time, but it continues to serve me well and not cause problems for the size of projects I'm usually working on. It includes Xdebug with all its PHP versions, which can be turned on in the PHP tab of its settings:
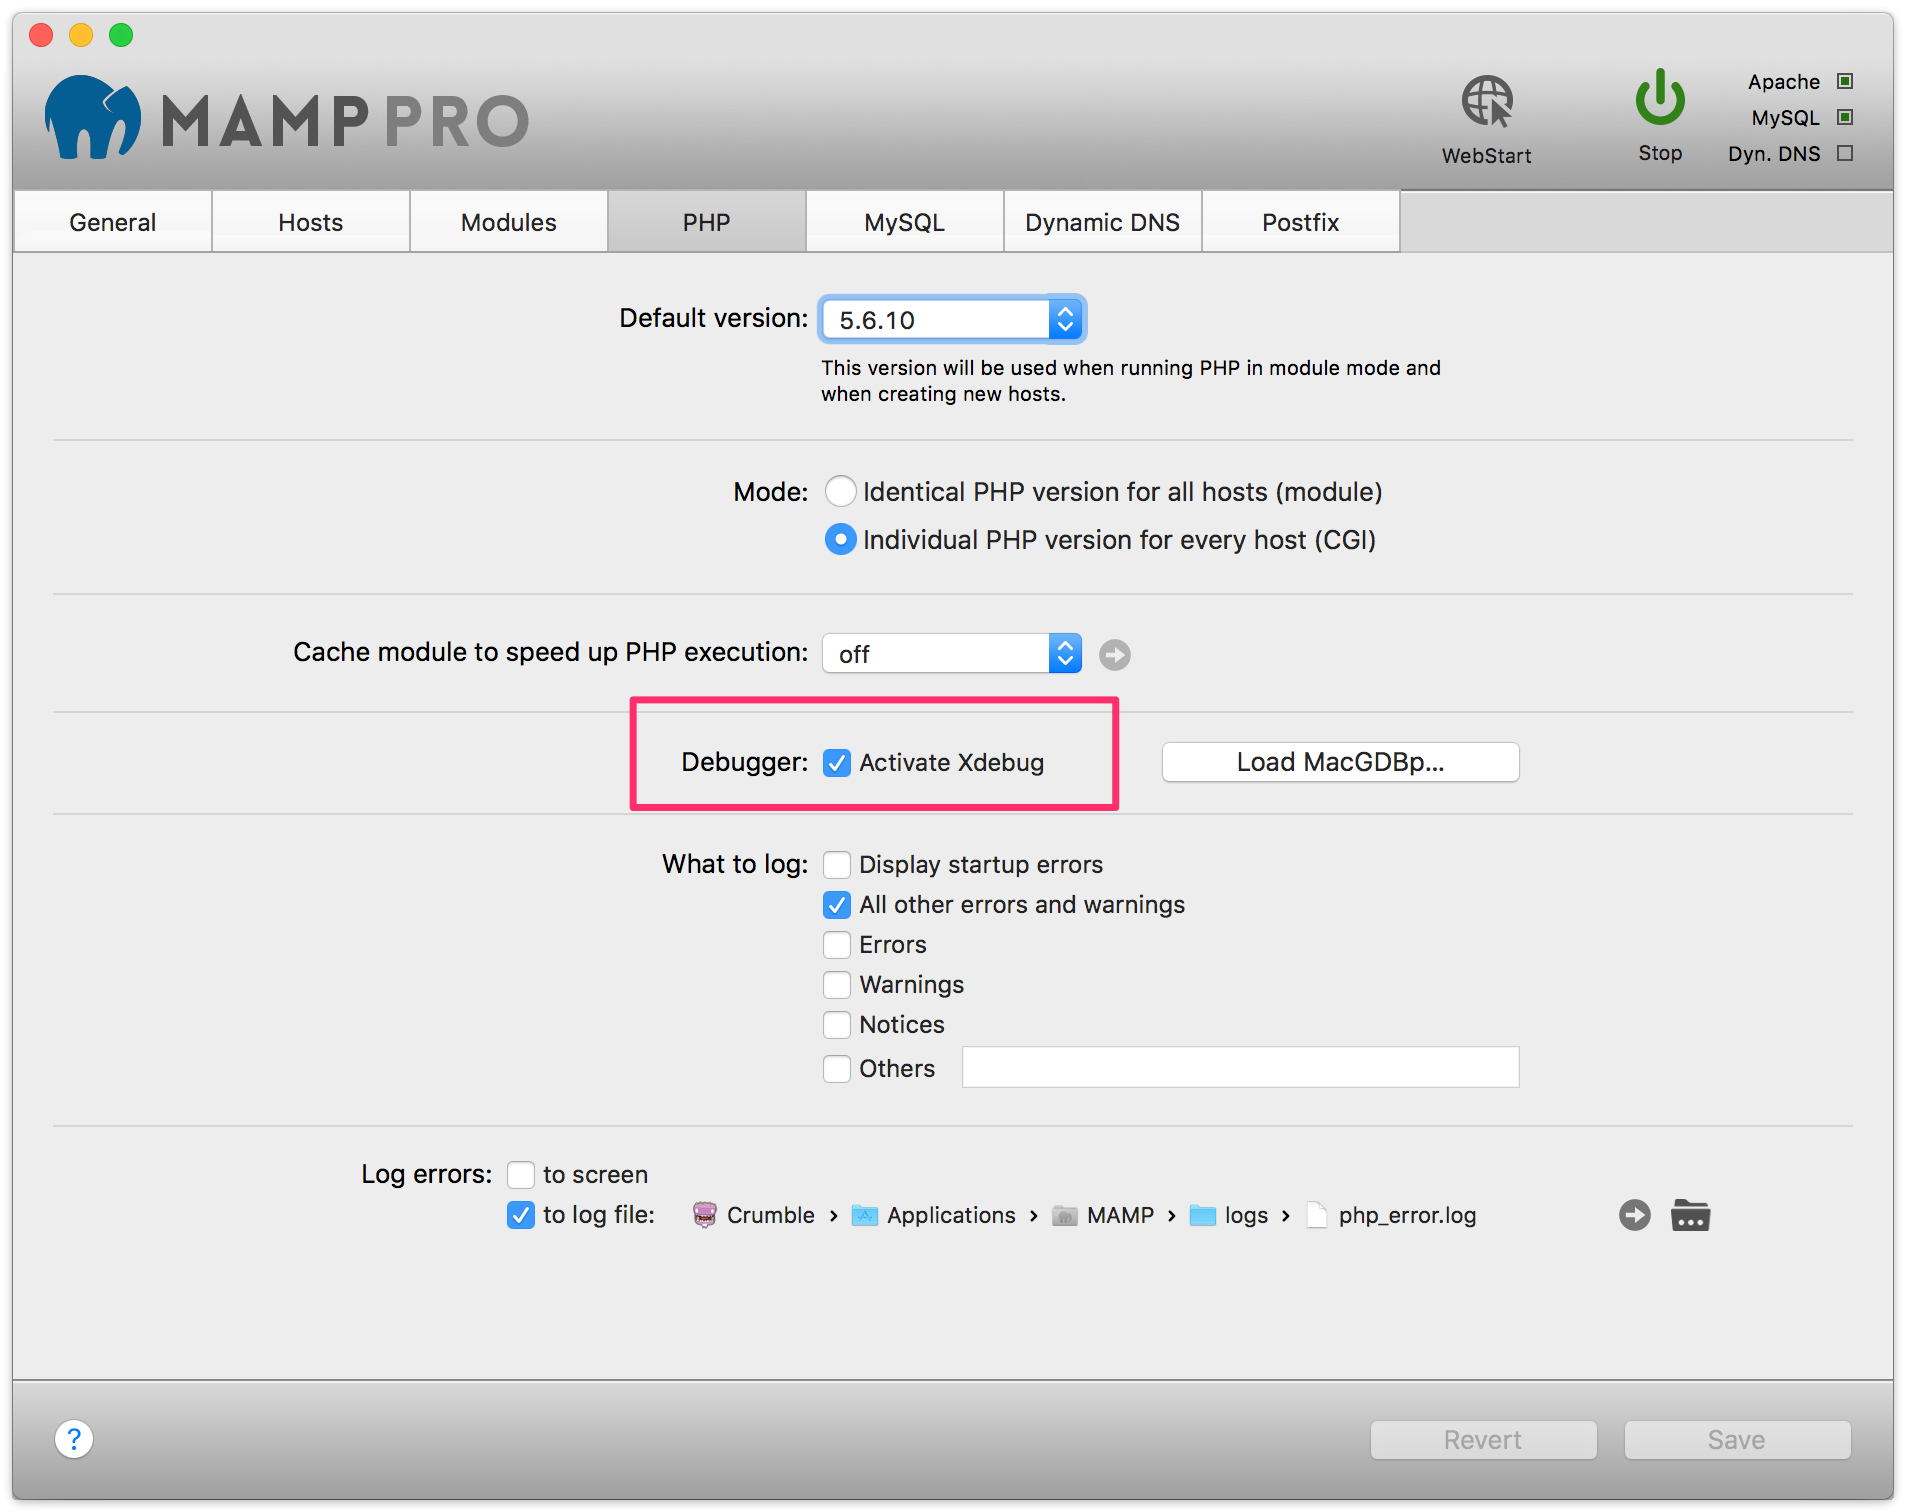
But if you run a command-line script like Drush or Artisan from the command line, even if you run them through the MAMP php binaries (see below), Xdebug will not be loaded automatically. This is actually a good thing, because Xdebug slows down PHP a lot, but you still need it when you want to debug. So we need to load it on demand. I imagine there's a way to do this with environment variables or command line switches, but I wasn't able to find one that worked for me. Thankfully, I can do it from PhpStorm.
Go to Preferences > Languages & Frameworks > PHP. There is a project setting for CLI Interpreter with a little ellipsis button.
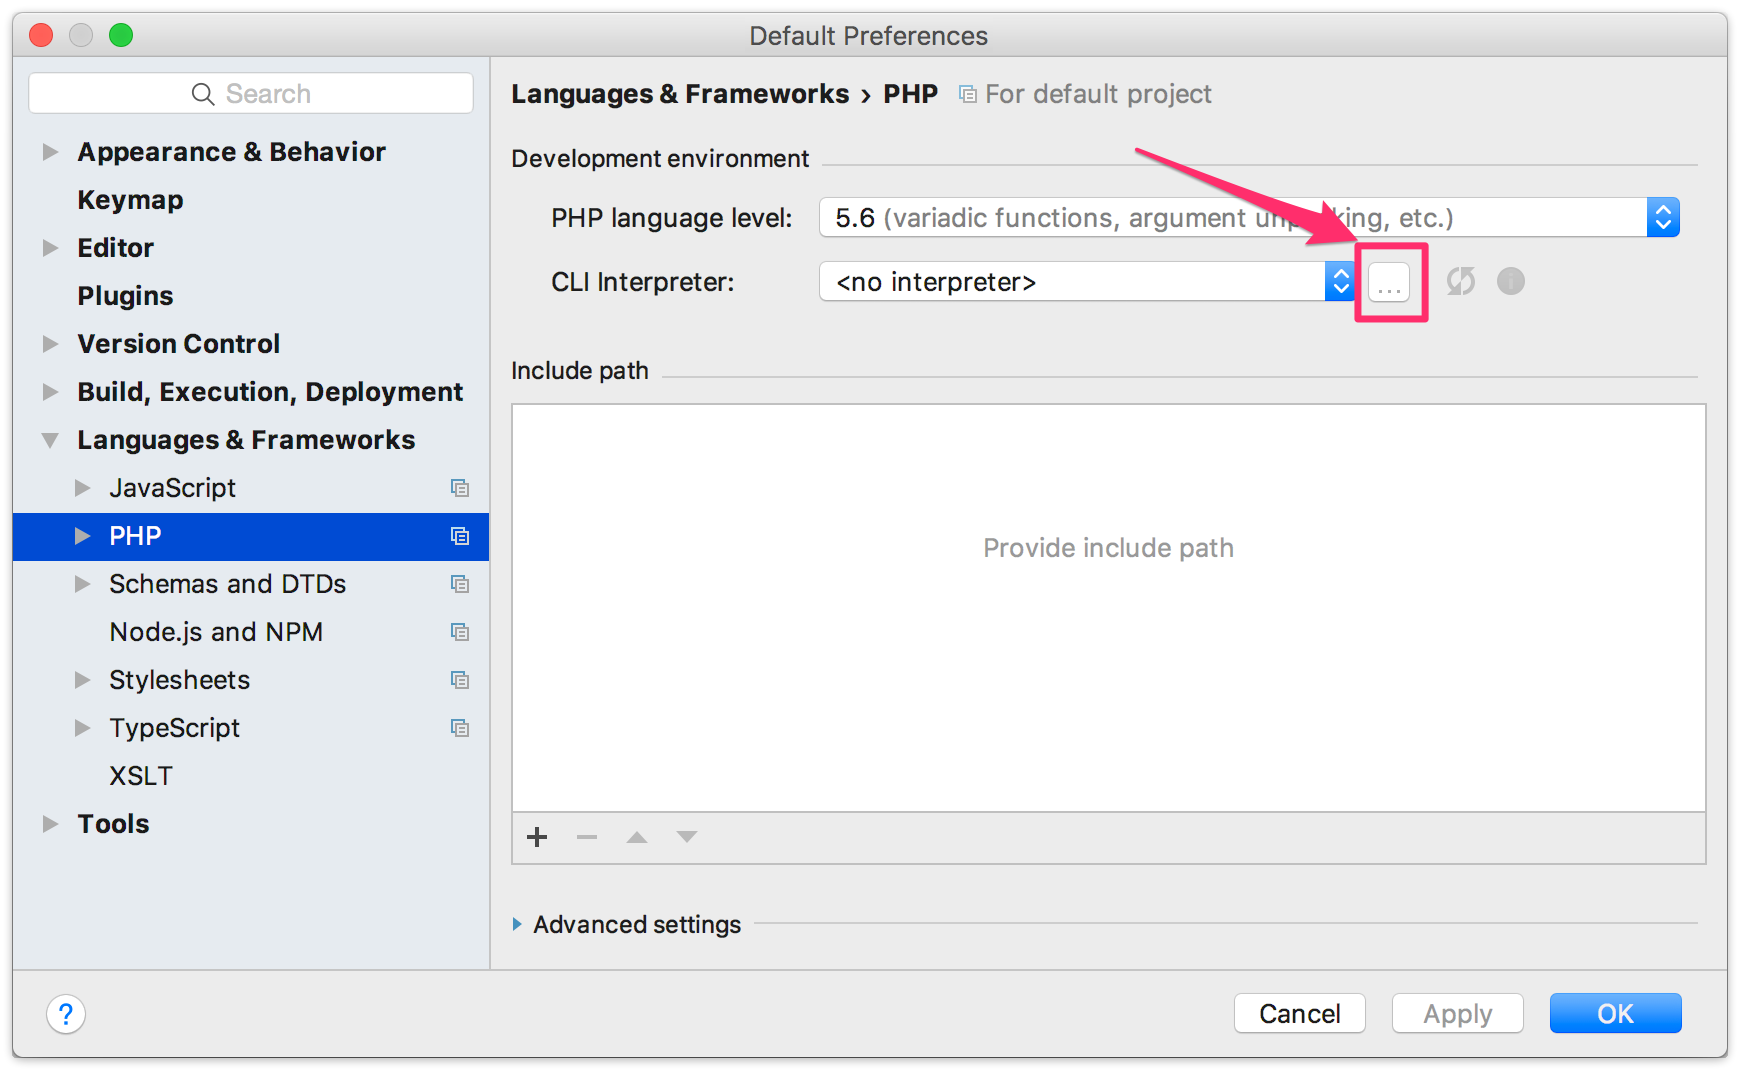
Click that to open a CLI Interpreter settings, where you can tell PhpStorm where to find any versions of PHP you can access to, both locally and remotely. To get to this quickly, use Help > Find Action (on macOS use Cmd-Shift-A) and type "CLI Interpreter" (you won't have to type all of it).
I've added each of the PHP binaries for versions 5.3 through 7 that come with MAMP. To make Xdebug available to each one, you can set its path in the "Debugger extension" setting. For MAMP, that path will look something like this depending on the version of PHP:
/Applications/MAMP/bin/php/php7.0.8/lib/php/extensions/no-debug-non-zts-20151012/xdebug.so
You can paste that setting in (I use Path Finder, which has a "Copy UNIX Path" command that makes this easy), or use the ellipsis button to open a standard file dialog from which you navigate to it.
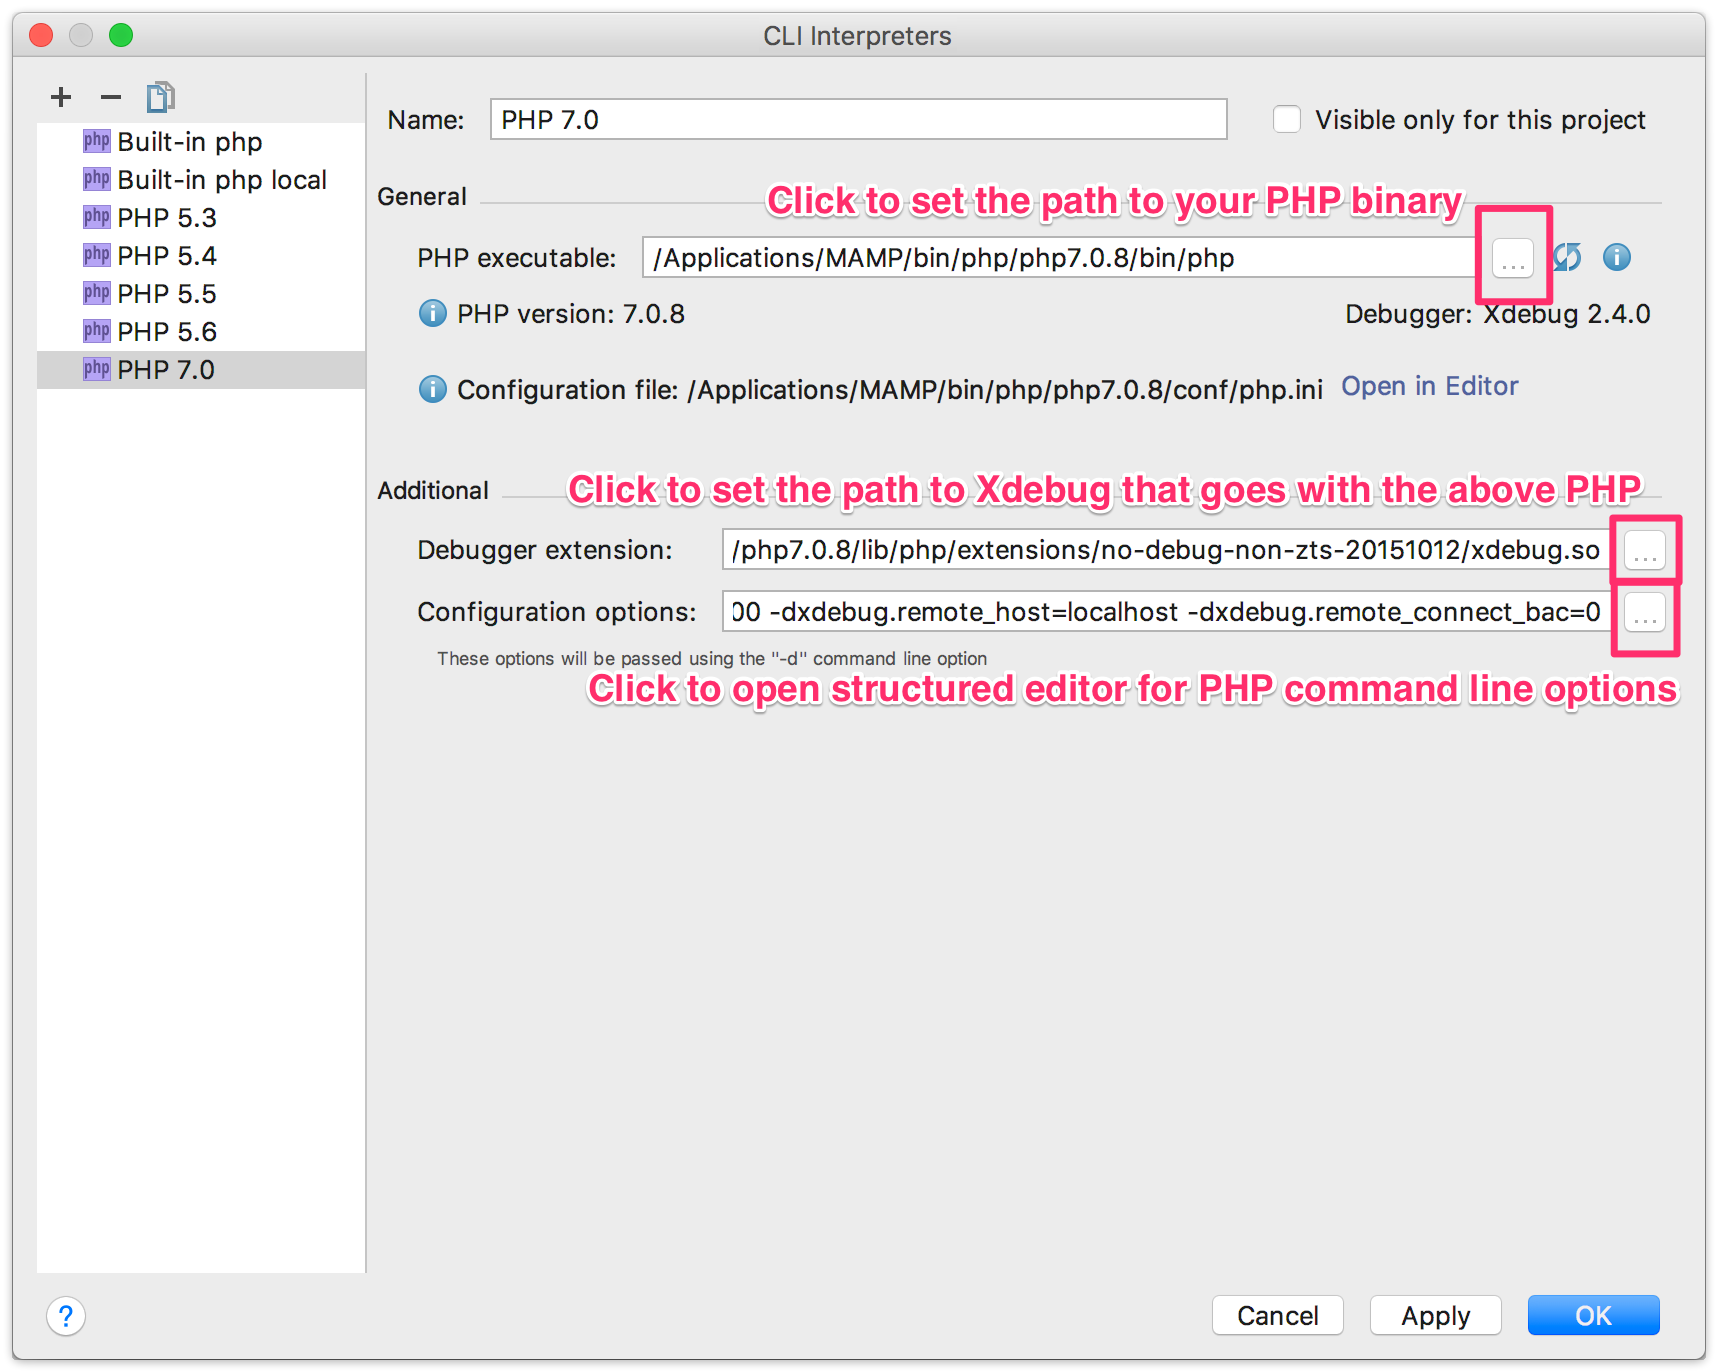
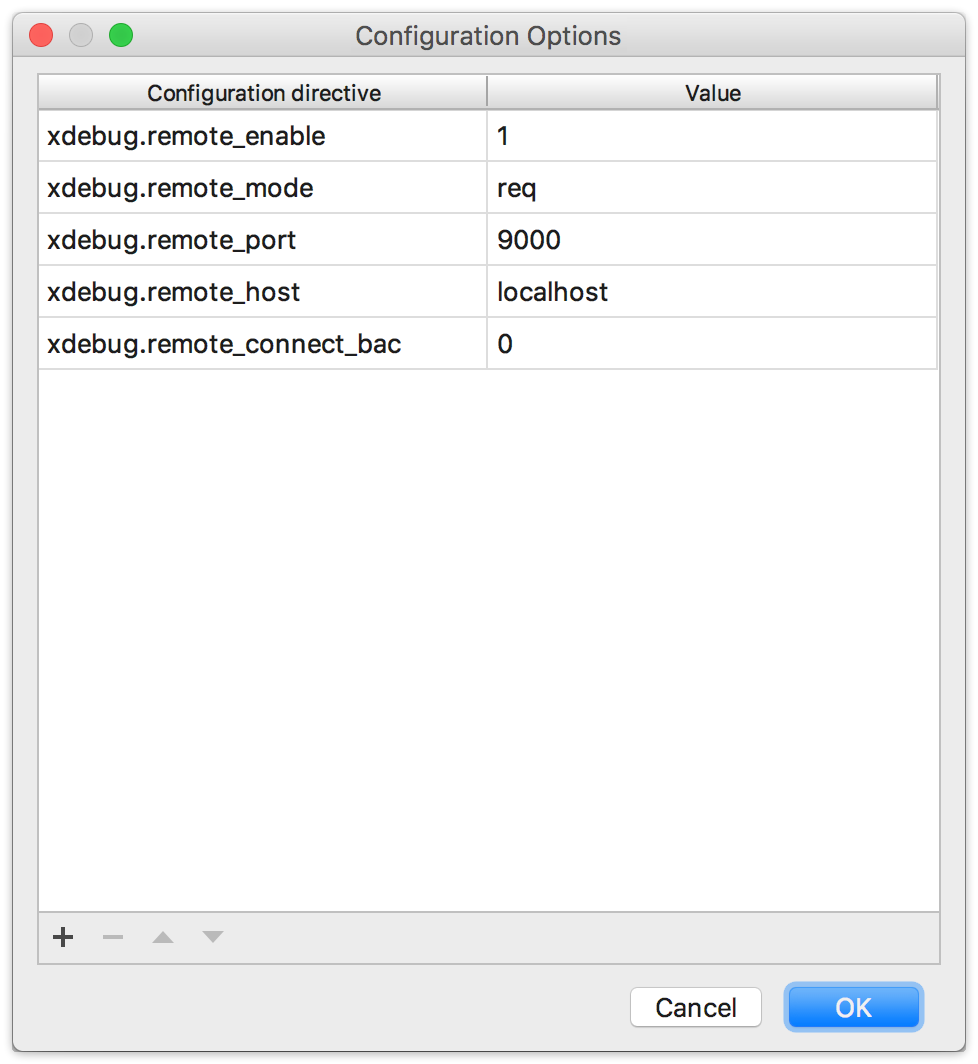
Finally, you should add the command line options that will tell Xdebug to make itself available in a way that PhpStorm can see. While "Configure options" looks like an editable field, it is not (at least in PhpStorm 2016.3). Click the ellipsis button next to the field to get a structured editor for all the options, and set them like this:
This is probably everything you need in terms of general setup. I also set an environment variable in my shell (I use fish), but I don't know if it's absolutely necessary.
set -x XDEBUG_CONFIG idekey=PHPSTORM
In other shells, you'd use setenv or export to do the same thing.
Project Setup
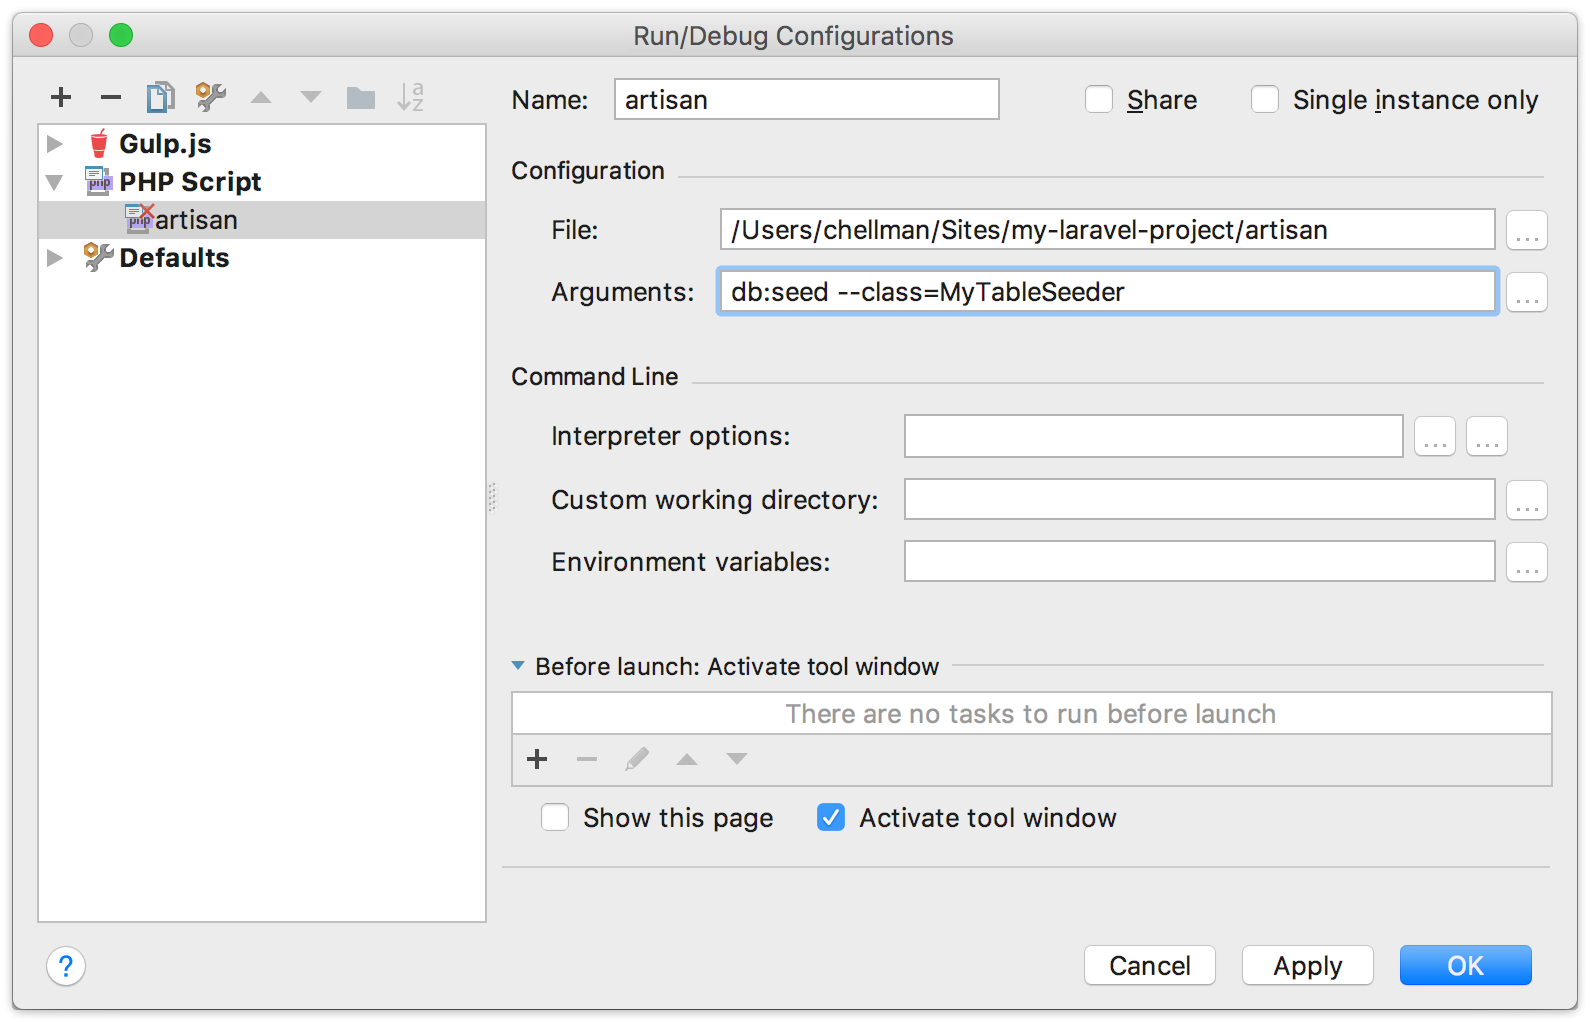
I first set all this up to debug a Laravel database seeder, which is used to populate a database with automatically-created fake data. But this works for any PHP script that's connected to a project you're working on. Because Laravel projects include their own version of artisan, it's pretty easy to debug it using a new debugging configuration.
Choose the menu item Run > Edit Configurations, or use Help > Find Action to get there faster. Create a new configuration with Cmd-N or the plus button, and choose "PHP script".
For File, set the path to artisan in your project, drush wherever you've installed it, or whatever the other command line script is you're using. Then for Arguments, set whatever needs to be passed in. Here's a sample for working with database seeding in Laravel:

With this done, you'll have a "Debug 'artisan'" command in the Run menu that will run the script with Xdebug attached, and stop at any breakpoints you've set.
For browser-based debugging, PhpStorm's "zero configuration debugging" works very well for me, but for the command line, this is working well. It's a little more configuration, but most of this is only set up once, and certainly saves me a lot of time once it's done.
You can read more about how to work with different versions of PHP, and with Xdebug in general, in the PhpStorm documentation:
https://www.jetbrains.com/help/phpstorm/cli-interpreters.html
https://www.jetbrains.com/help/phpstorm/configuring-xdebug.html